Data quality log
definition
This module is used to record and display the execution log and evaluation results of data quality evaluation tasks. It helps users track the execution of each task, view the results of specific quality rules, and manage discovered problem data to ensure that quality problems can be checked, managed, and controllable.
Module features
- 📄Task Execution Log: Check the execution status, time consumption, scheduling method, executor and other information of each quality task;
- 📊Rule evaluation results: View the execution results of each configured quality rule under the task, including the number of exceptions, total number, exception proportion, etc.;
- 🧯Problem Data Management:
- The list displays the abnormal data discovered by each quality rule, including evaluation fields, error descriptions, and data samples;
- Supports marking to ignore single or batch data;
- Supports operations such as adding notes, manual processing, and resetting status to problem data;
- Supports multi-condition filtering and quick retrieval.
Things to note
It is recommended that the processing records of problem data be reviewed regularly to avoid the risk of misprocessing or omission; log and report data should support one-to-one correspondence with quality tasks to ensure traceability.
Scope > For quality managers and data managers, it is used forvisualization of the evaluation processandcontinuous tracking and processing of problem data, and cooperates with quality evaluation tasks to achieve a closed-loop quality management process from problem discovery to processing.
1. Quality task log
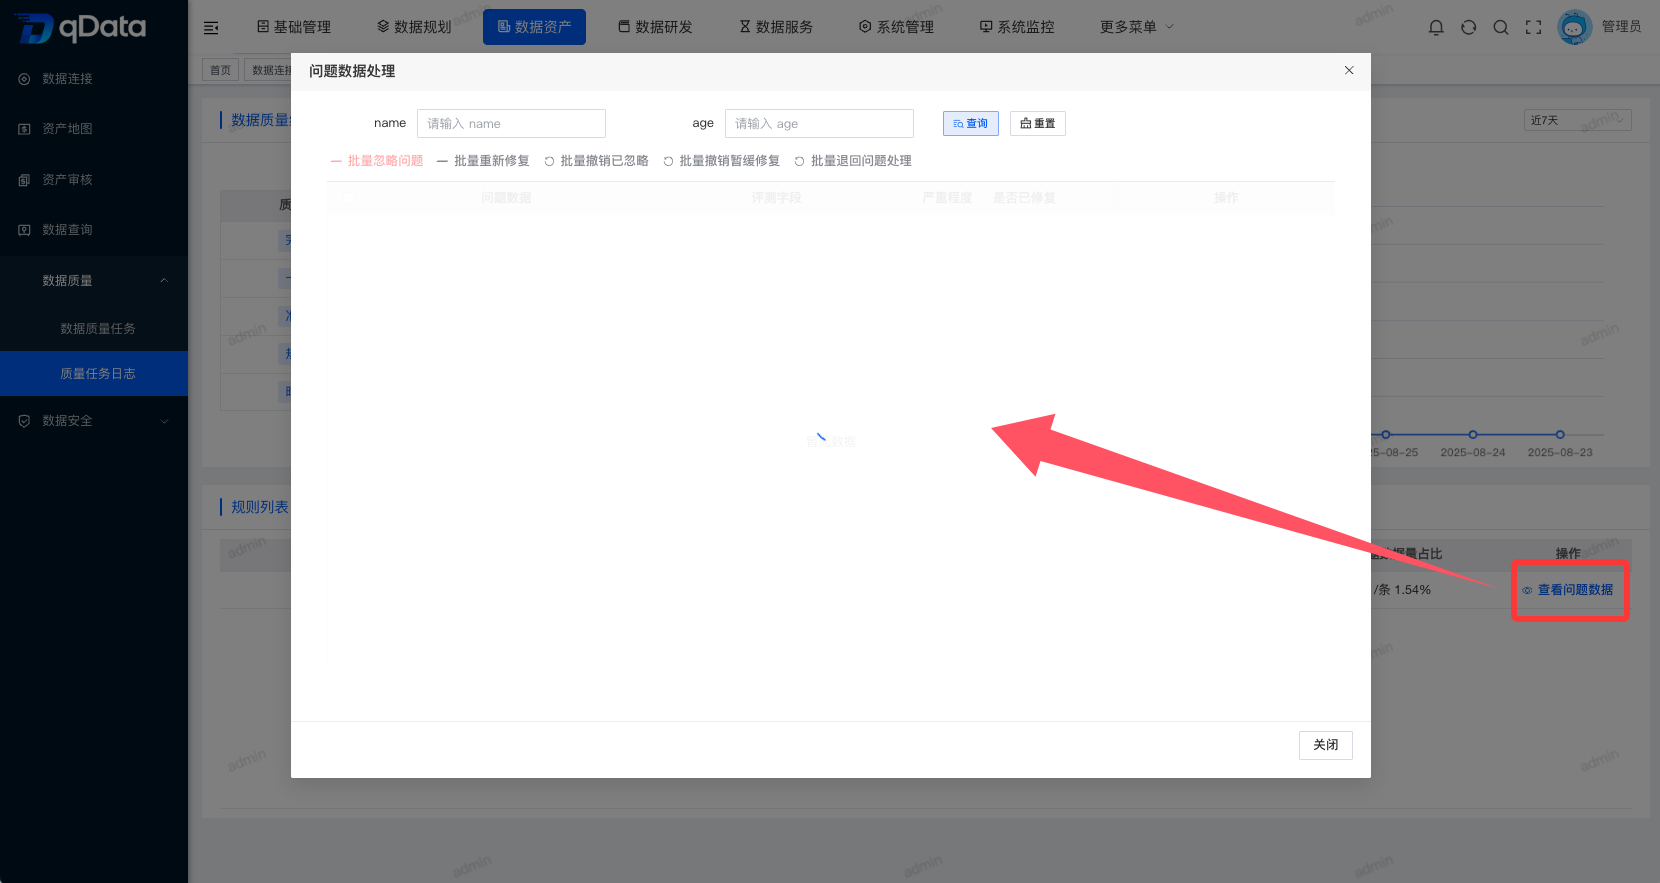
Click [Quality Task Log] under [Data Assets]->[Data Quality] to enter the quality task log page. The page displays the quality task log list including number, task name, quality score, execution status, problem data, start time, end time and other fields.
2. Details
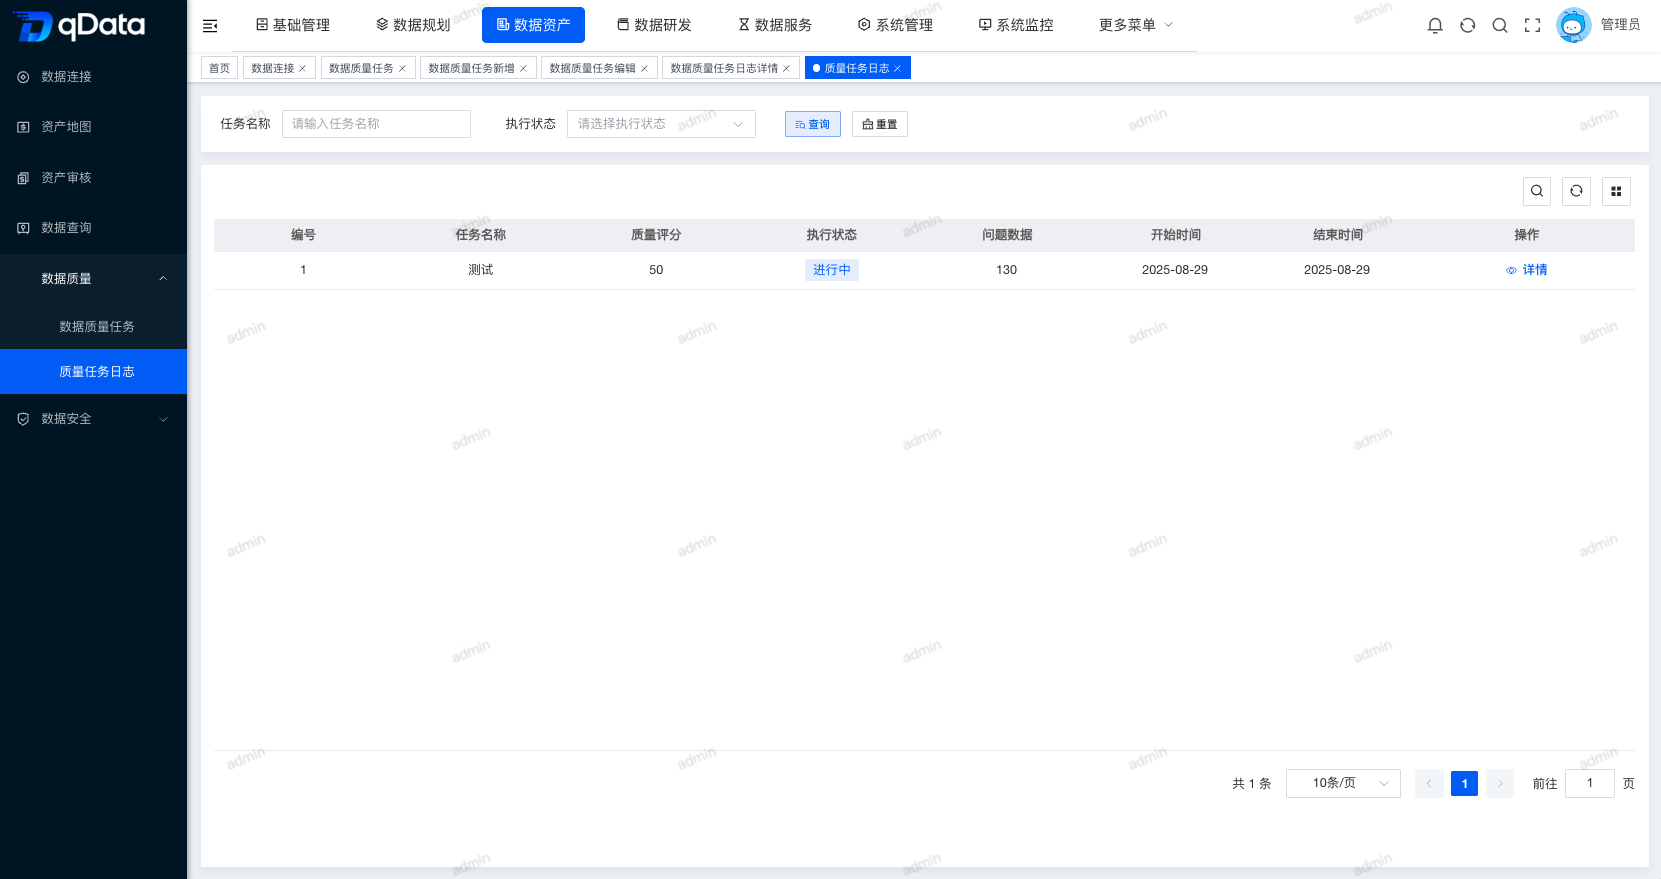
Select the quality task log whose details you want to view and click the [Details] button in the operation column to view the details of the quality task log.
2.1 Change trend of governance data volume
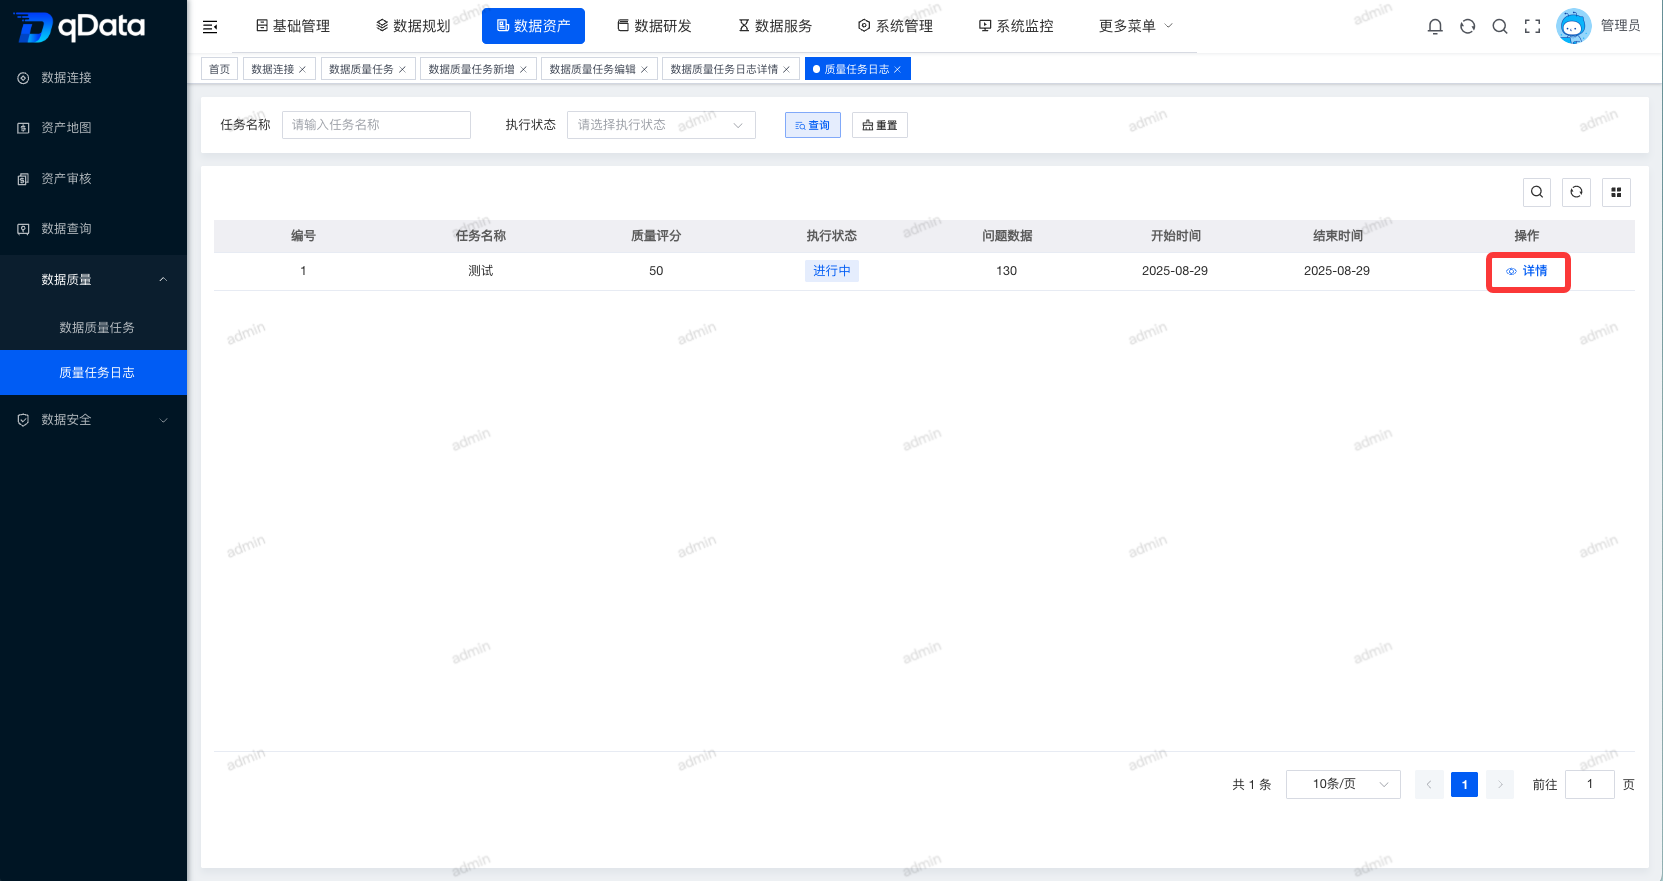
Select the statistical time of the last 7 days, the last 15 days, and the last 30 days to view the data volume change trend.
2.2 Rule list
The details page contains a list of rules. The list includes related fields such as evaluation name, database name, field name/Chinese name, quality dimension, audit name, problem data volume proportion, etc. Click the [View Problem Data] button in the operation column of the rule list to enter the problem data processing pop-up window.
2.2.1 Problem data processing
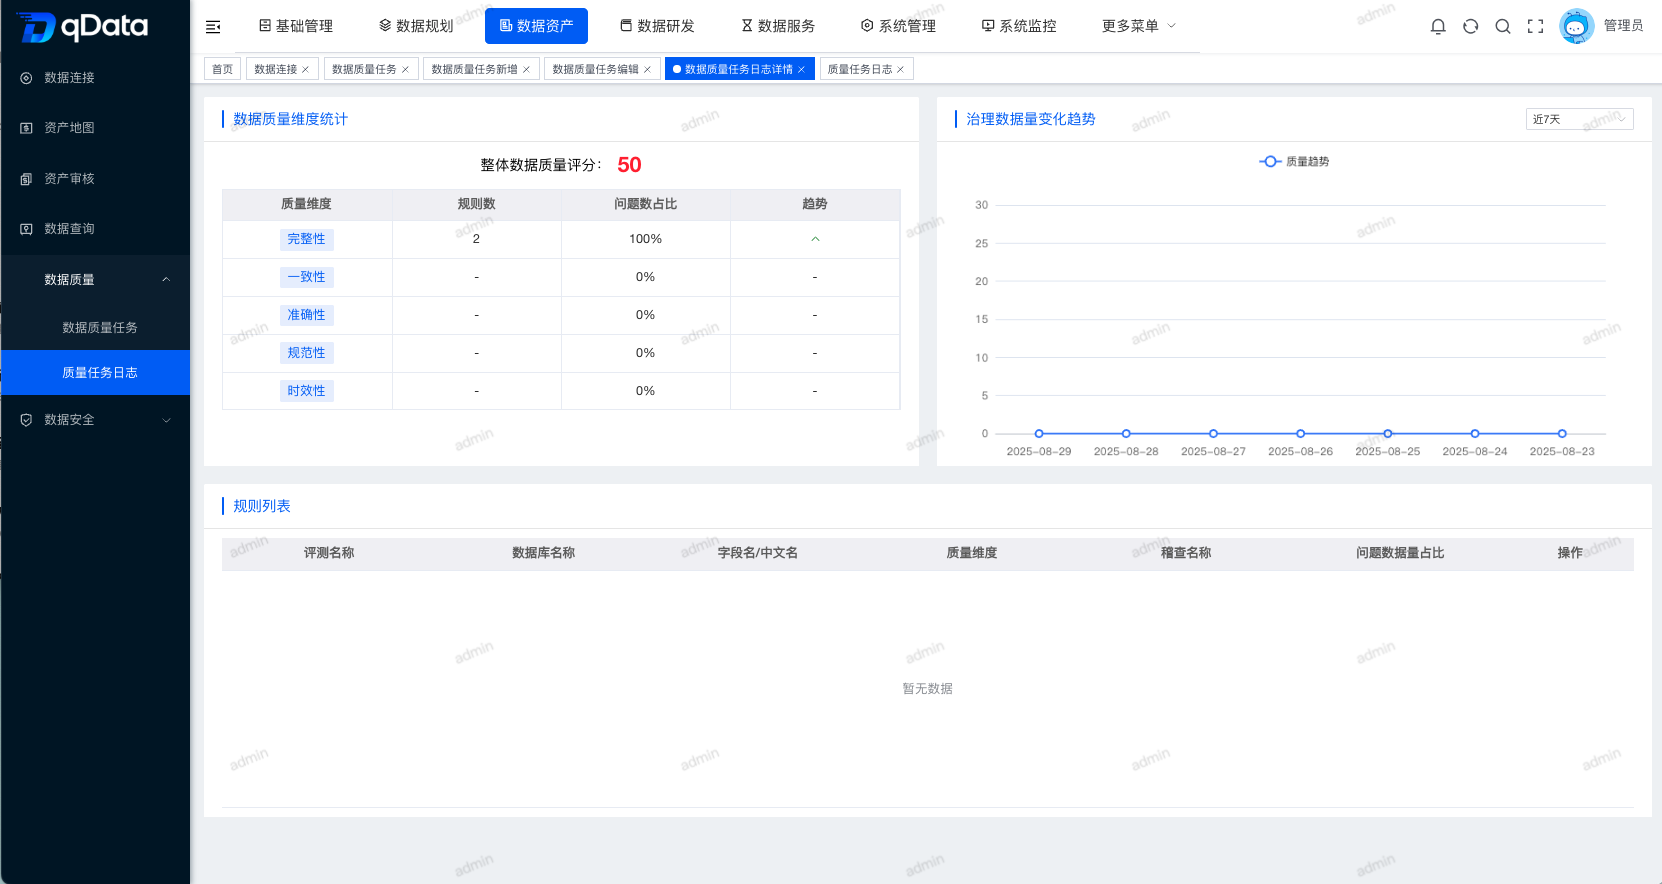
The problem data processing pop-up window contains a problem data list, which includes problem data, evaluation fields, severity, error description, repair suggestions, evaluation date and other related fields. Click the [Ignore], [Add Note], and [Process] buttons in the operation column to complete the corresponding operation.