
Data Development Instance
Feature overview
Functional positioning
Data Development Instance is used to query node instances generated by data development tasks, verify success or failure status, and view or download the runtime log of the target node.
In short: this is where you find runtime records for a data development node and use logs to understand why it succeeded or failed.
Usage suggestions
First locate node instances by data development category and query conditions, then verify execution status. Click View Log for troubleshooting, and use Download Log when the log needs to be retained.
Main features
- Category search: Locate node instances by data development category and its subcategory scope.
- Combined query: Supports node instance name, task name, execution status, and execution time conditions.
- Status comparison: The same list can show both successful and failed instances.
- Log viewing: Open the View Log dialog from the current list page and scroll through the content.
- Log download: Download the
.logfile corresponding to the target node instance. Both page and file output must meet sensitive information masking requirements.
Scope
This page is used to browse and troubleshoot generated data development node instances. It does not provide node instance add, edit, delete, rerun, or scheduling operations.
Preliminary steps
Preconditions
- You have logged in to the qData platform and can enter the Data Development module.
- You have switched to the project space to be viewed.
- Data development tasks have run and generated node instances.
Navigation path
Data Development > Operations Management > Data Development Instance
Page overview
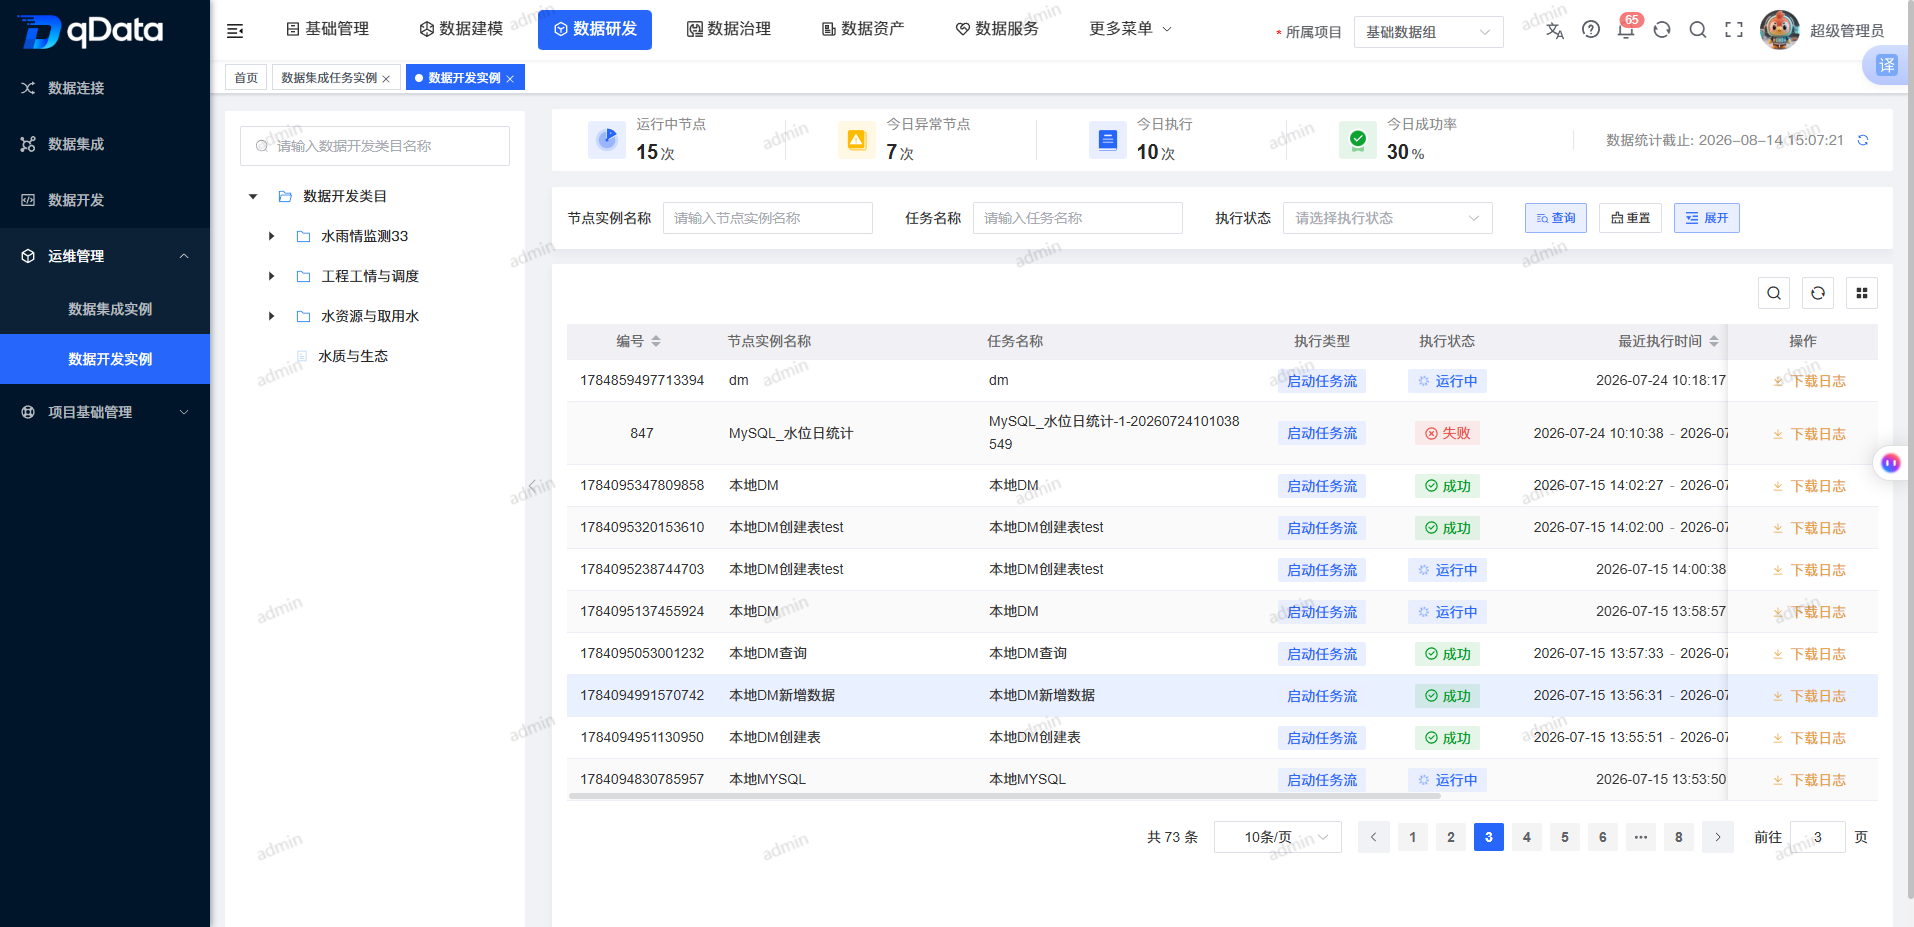
The left side of the page contains data development category search and the category tree. The right side contains the query area, node instance list, list helper controls, and pagination. The operation column provides View Log and Download Log.
Recommended operating procedures
Typical scenario: Select a data development category -> enter query conditions -> click Query -> verify success or failure status -> view or download logs.
Troubleshooting: Locate a failed instance -> click View Log -> scroll through exception information -> confirm the log is masked before downloading or sharing it.
Functional operation instructions
Query and reset node instances
- Enter the data development category name in the category search box on the left to filter the category tree.
- Click the category node, and the list will be refreshed according to the category and its subordinate categories.
- The top area displays instance runtime statistics, including running, today's exceptions, today's executions, and today's success rate.
- Enter a node instance name or task name, or select an execution status.
- Click Query, and the list refreshes according to the current combined conditions.
- Click Reset to clear query conditions, date range, and category selection, restoring the default list.
View node instance list
By default, the list is displayed from newest to oldest by start time. Use horizontal scrolling to view all fields.
| Field Name | Description | Required or not |
|---|---|---|
| Number | Node instance record identifier. | Not applicable, read only |
| Node instance name | The name of the instance running on this node is also the basis for log file identification. | Not applicable, read only |
| Task name | The task to which the node instance belongs. | Not applicable, read only |
| Execution type | The execution method of this instance is displayed as a label. | Not applicable, read only |
| Execution status | The result of this instance execution, the success and failure labels are visible. | Not applicable, read only |
| Start time / End time | The start and end time of the node instance. | Not applicable, read only |
| Responsible person | Instance responsibility information. | Not applicable, read only |
| Creator/Creation time | Instance creation information, if there is no value, the page placeholder will be used. | Not applicable, read only |
| Operation | Provides [View Log] and [Download Log]. | Not applicable, read only |
View node logs
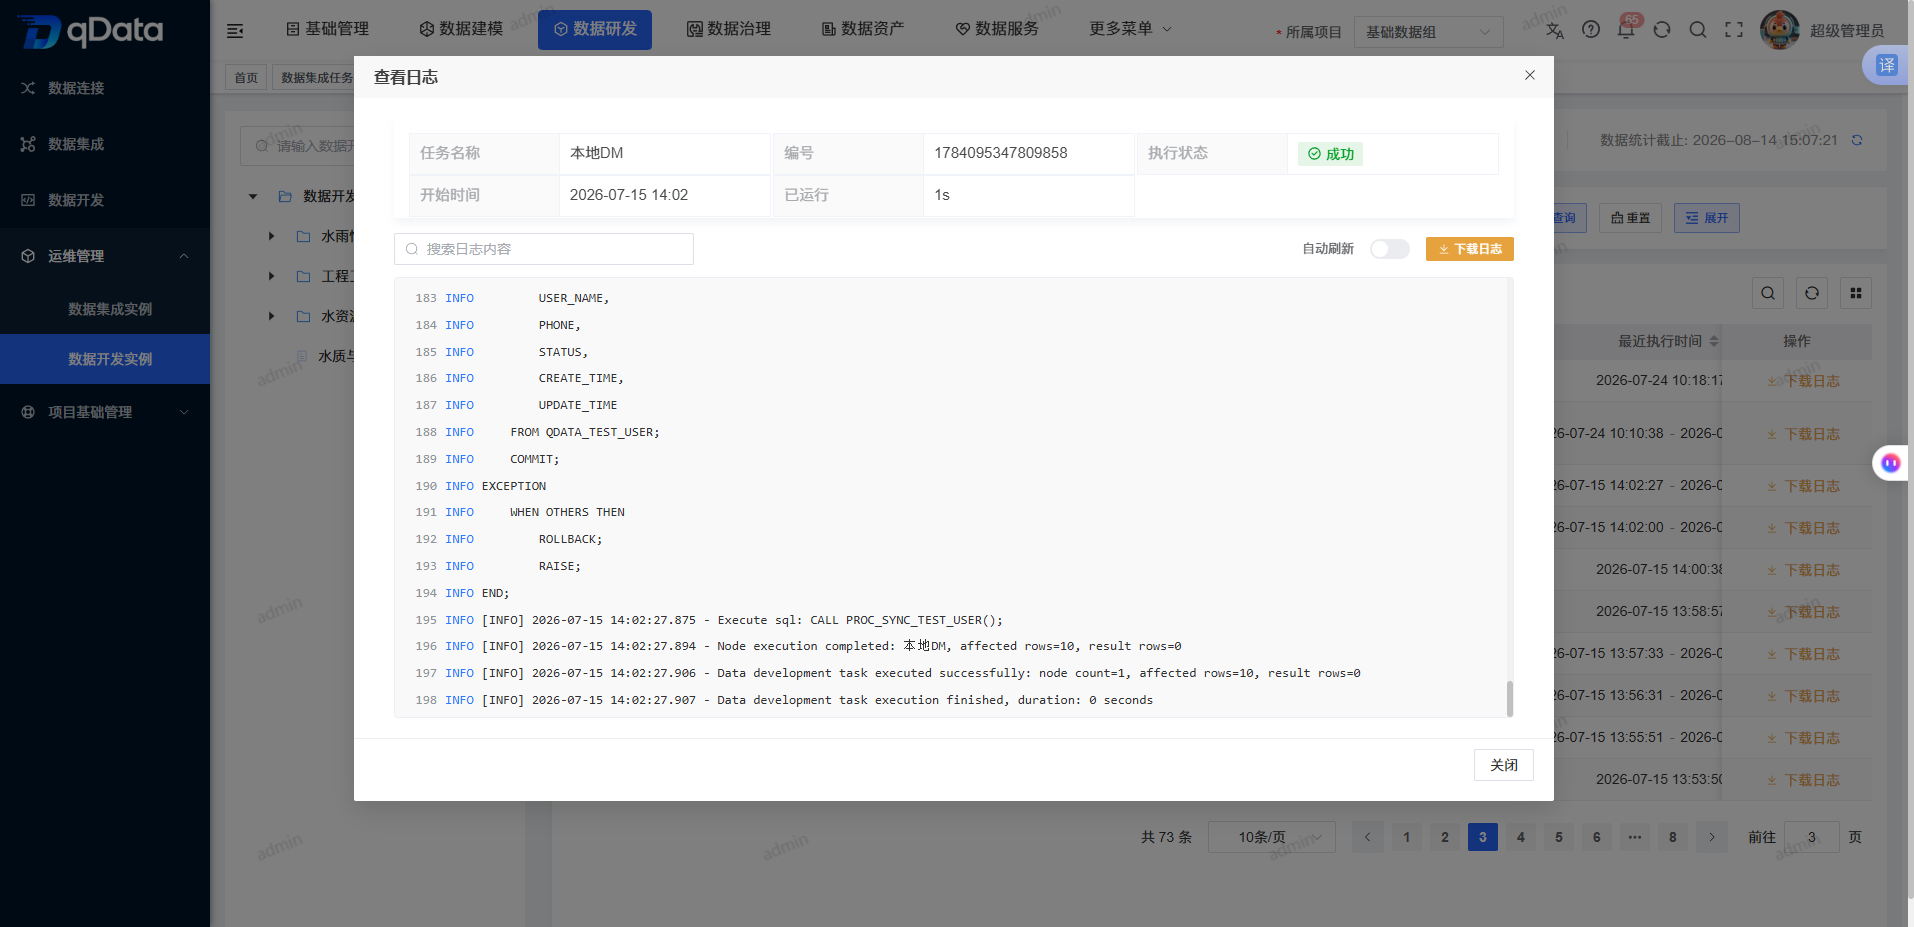
- Click [View Log] in the target node instance row.
- The page opens a pop-up window titled [View Log] above the current list.
- Scroll vertically to view the log text.
- The exception information of the failed instance is displayed through the log text, and the page does not generate an additional structured failure summary.
- Click [Close] at the bottom or the close icon in the upper right corner to return to the original list context.
Download node logs
- Click [Download Log] in the target node instance row.
- The browser receives the
.logfile identified by the node instance name. - Confirm that the downloaded file corresponds to the current node instance.
- Confirm that the file does not contain a directly usable password, token, or original connection string value before using or delivering the log.
FAQ
**Why are there both successful and failed records in the list?**The
page focuses on displaying the running results of node instances, with different status labels used for success and failure. The scope can be narrowed by execution status conditions.Where can I check the failure reason?
Click [View Log] on the failed instance to troubleshoot through the task execution exception information in the log text; this issue does not provide a structured failure summary.Can downloaded log files be passed directly?
can only be used or passed after confirming that the password, token and connection string have been desensitized; display and downloading should be stopped when sensitive original values are found.
Summarize
The data development instance page is used to locate node running records, check success or failure status, and obtain logs. When using it, you must also pay attention to whether the target node is correct, whether the status matches, and whether the log desensitization is completed.